VPC CNI vs Cilium CNI Performance Comparison Benchmark
Overview
This report compares the responsibilities of VPC CNI and Cilium and examines five configuration summaries dated February 9, 2026. The repository contains aggregate JSON and runner scripts, but no original iperf3/Fortio logs, replicate results or effective Helm values from those runs. Treat the numbers as reported historical observations, not a reproduced product ranking.
The September 2026 review corrects mean RTT mislabeled as percentiles, an HTTP p99 value attributed to E instead of D, and measurement conditions that disagreed with the runner. It removes per-option improvement claims and service-scaling charts without supporting run artifacts. No cluster or benchmark was executed during this review.
Choosing a CNI involves IP allocation and routing as well as service load balancing, policy and observability requirements. Performance comparisons become useful when configurations satisfy the same requirements and are measured with the actual application.
Test Environment
These settings come from cluster.yaml and run-all-scenarios.sh. They describe the intended setup; they do not establish the effective environment of the stored runs.
Table 1. Declared test-environment configuration and interpretation notes
| Item | Recorded configuration | Interpretation |
|---|---|---|
| Cluster | EKS 1.31, ap-northeast-2, cni-bench | Historical experiment input, not a current version recommendation |
| Nodes | Three m6i.xlarge instances; node group in one Availability Zone | 4 vCPUs and 16 GiB each; networking is specified as up to 12.5 Gbps, not a sustained baseline of 12.5 Gbps |
| Cilium | Helm chart 1.16.5 | Effective values and image digests were not preserved |
| Workloads | iperf3, Fortio and httpbin in namespace bench | Some images use latest; placement constraints do not guarantee separate client and server nodes |
A new experiment should also record the kernel, ENA driver, AMI, MTU, CNI and kube-proxy versions, Pod/node placement and load-generator CPU use.
Test Scenarios
The runner requests the following configurations. Status output confirming the active data paths is unavailable.
Table 2. IP allocation, service processing and additional settings across the five scenarios
| Scenario | IP allocation and routing | Service processing | Additional settings |
|---|---|---|---|
| A | VPC CNI | kube-proxy | Initial configuration |
| B | Cilium cluster-pool, VXLAN | kube-proxy retained | Hubble disabled |
| C | Cilium cluster-pool, VXLAN | Cilium kube-proxy replacement | Hubble disabled |
| D | Cilium ENI IPAM, native routing | Cilium kube-proxy replacement | Prefix delegation requested; Hubble disabled |
| E | Same IPAM/routing family as D | Cilium kube-proxy replacement | Host routing, BPF masquerade, conntrack sizing, socket LB, Bandwidth Manager/BBR, DSR and native XDP settings |
Scenario E Tuning Points
E sets loadBalancer.mode=dsr and loadBalancer.acceleration=native. This contradicts the earlier statement that DSR and XDP were excluded. Requesting a setting does not prove that it became active on the selected nodes and drivers.
Hubble is already disabled from B onward, so it is not a new D→E change. B and C do not enable Bandwidth Manager. Because several settings change together, the recorded RTT and UDP loss differences cannot be assigned to individual options.
Architecture
Packet Path Comparison: VPC CNI vs Cilium
VPC CNI IP allocation and kube-proxy Service forwarding have different responsibilities. Cilium also configures IPAM/routing separately from kube-proxy replacement. Direct Pod-IP traffic, ClusterIP traffic and external NodePort traffic follow different paths; one measurement should not stand in for all of them.
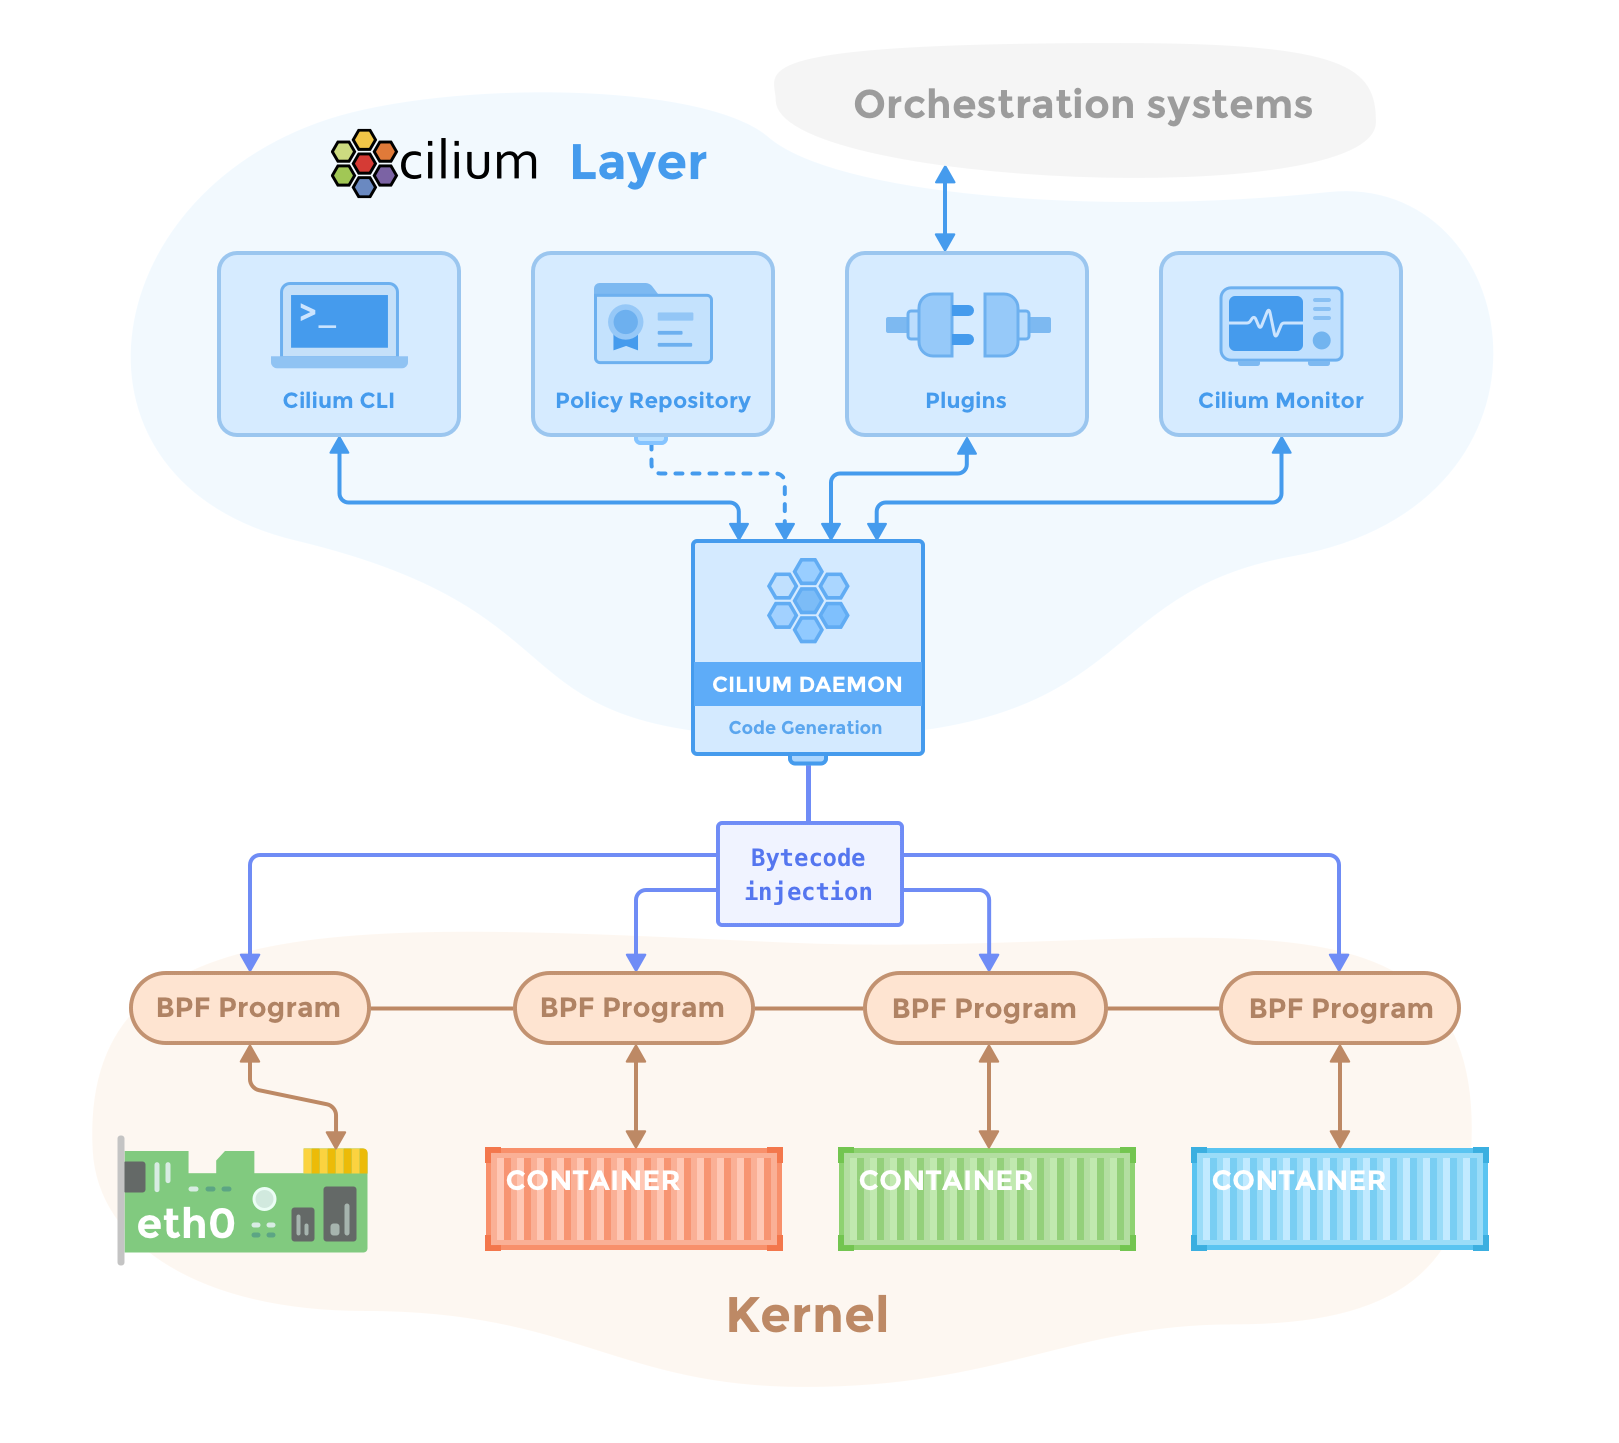
Cilium Architecture Overview
The Cilium agent configures networking and policy on each node. The operator performs cluster-level work, including IPAM operations for applicable modes. This existing conceptual diagram explains component roles; it does not prove which features were enabled in the experiment.
Figure 1. Conceptual Cilium agent and operator component architecture
Cilium eBPF Packet Path
eBPF programs perform forwarding and policy work at selected hooks. Socket load balancing, host routing, tunneling and L7 proxy use affect the actual path. The diagram below is a historical Cilium 1.13-era reference. It is not an exact execution trace for the 1.16.5 experiment or a current release.
Figure 2. Historical Cilium 1.13-era eBPF packet path between endpoints

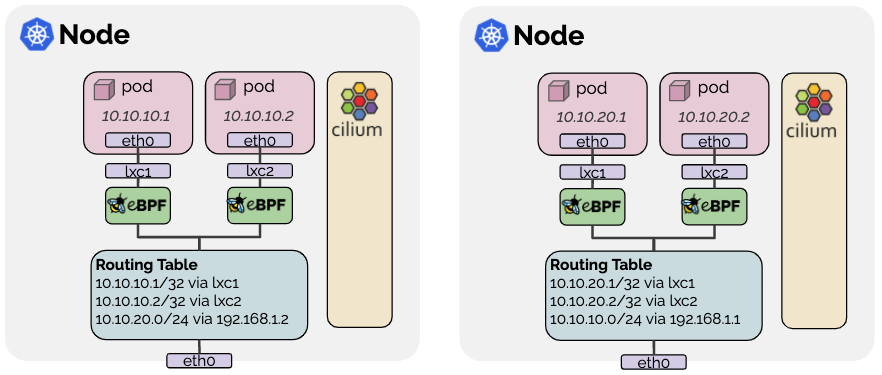
Cilium Native Routing (ENI Mode)
Native routing lets the underlying network route Pod traffic without tunnel encapsulation. ENI IPAM allocates Pod addresses through AWS ENIs; these are separate concepts. VPC routes, security groups, return paths and MTU must also support the intended communication.
Figure 3. Conceptual Cilium native routing (ENI mode)
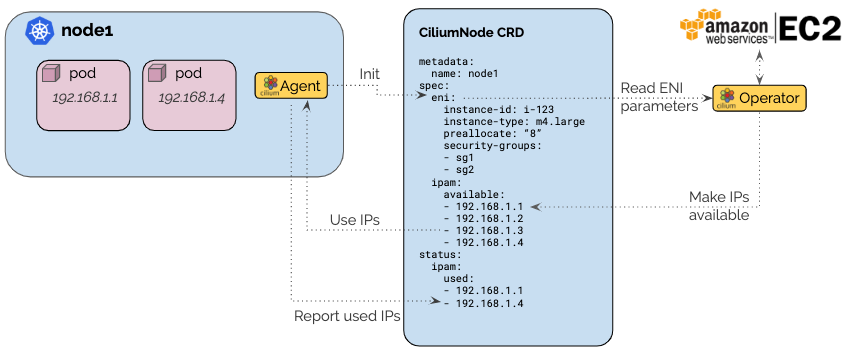
Cilium ENI IPAM Architecture
ENI IPAM depends on AWS API permissions, available subnet addresses and instance ENI/IP limits. Setting chart options does not establish that these permissions and network prerequisites exist.
Figure 4. Conceptual Cilium ENI IPAM architecture
Data Plane Stack Across 5 Scenarios
A→B changes the CNI and encapsulation, B→C changes Service processing, C→D changes IPAM/routing, and D→E changes several data-path options. Running those steps in sequence does not isolate a single cause for each observed difference. A new experiment should retain the same placement and include comparisons that change one setting at a time.
Test Methodology
Test Workloads
workloads.yaml deploys iperf3 sender/receiver Pods and HTTP clients/servers. CPU requests, server replicas and Service endpoint placement can affect results. Separate same-node, cross-node and cross-AZ runs, and preserve actual Pod IPs and node names.
Measured Metrics
Table 3. What run-benchmark.sh does for each metric and what it represents
| Metric | What run-benchmark.sh does | What it represents |
|---|---|---|
| TCP throughput | 30 seconds, eight parallel streams; extracts receiver end.sum_received.bits_per_second | Received throughput for those connections and placement |
| UDP throughput/loss | 30 seconds, -u -b 10G; extracts end.sum fields | A 10-Gbit/s target, not unlimited traffic; preserve sender and receiver logs |
| TCP mean RTT | 10 seconds, --length 1; extracts the first sender's mean_rtt | Sender mean TCP RTT, not a TCP_RR request/response test or p50/p99 |
| HTTP | Separate 30-second runs: 1,000-QPS target/32 connections, 5,000-QPS target/64 connections, uncapped QPS/64 connections | Requested and achieved load differ; errors and response content need separate validation |
| DNS | Shell timing around 200 getent hosts invocations | Includes process startup and name resolution, not just DNS-server latency |
Running Benchmarks
The existing scripts and summaries are historical experiment material. run-all-scenarios.sh creates a cluster and deletes aws-node and kube-proxy while changing the network configuration. It is not a validated reproducer or a migration guide for an existing cluster.
Before a new run, define a dedicated account, cluster, region and cost scope; check each configuration's support, IAM and recovery requirements. Preserve raw logs, exit codes, response validation, effective values and image digests in per-run directories. Exclude failed runs from success metrics. The current runner overwrites the same summary filename and does not retain a replicate distribution. Also verify that resource cleanup is actually invoked.
Benchmark Results
The values below match the stored JSON. That agreement does not verify successful execution, sample counts or measurement uncertainty. Without original logs, do not describe these results as medians of three or more runs or assign a 5% error bound.
Network Performance
TCP/UDP Throughput
TCP throughput
0–14 Gbps
Stored values range from 12.34 to 12.41 Gbps. This narrow range does not establish equivalence for other traffic patterns.
UDP throughput
0–14 Gbps
A and D report 20.39% and 20.42% loss. Without sender and receiver logs, do not subtract loss again from this field or treat it as loss-free throughput.
| Scenario | TCP (Gbps) | UDP (Gbps) | UDP loss (%) |
|---|---|---|---|
| A: VPC CNI | 12.41 | 10.00 | 20.39 |
| B: Cilium + kube-proxy | 12.34 | 7.92 | 0.94 |
| C: Cilium, no kube-proxy | 12.34 | 7.92 | 0.69 |
| D: Cilium ENI | 12.41 | 10.00 | 20.42 |
| E: Cilium ENI, additional options | 12.40 | 7.96 | 0.03 |
Recorded TCP values are near the instance's advertised maximum network specification. They do not establish identical performance at other connection counts, packet sizes or durations. Examine the load generator and receiver statistics before drawing a broader conclusion.
Pod-to-Pod Latency
Mean RTT
0–6000 µs
E has the smallest stored value, but several settings changed together. These records do not establish an individual option’s effect or a reproducible improvement rate.
| Scenario | Mean RTT (µs) |
|---|---|
| A: VPC CNI | 4894 |
| B: Cilium + kube-proxy | 4955 |
| C: Cilium, no kube-proxy | 5092 |
| D: Cilium ENI | 4453 |
| E: Cilium ENI, additional options | 3135 |
Mean TCP RTT and HTTP p99 measure different things. Multiplying this RTT by an agent's tool-call count does not establish end-to-end response time or user-visible improvement.
UDP Packet Loss Rate
Table 4. Stored UDP packet loss rate by scenario
| Scenario | Stored loss rate |
|---|---|
| A | 20.39% |
| B | 0.94% |
| C | 0.69% |
| D | 20.42% |
| E | 0.03% |
The loss differences are recorded; their causes are not established. Compare send rate, receiver CPU, packet size, pacing, queues and driver state. Bandwidth Manager's documented capabilities are separate from the evidence for these particular observations. BBR is TCP congestion control and should not be presented as the direct cause of a UDP result.
HTTP Application Performance
p99 @ 1,000 QPS
0–12 ms
D reports 8.75 ms; E reports 9.89 ms. The earlier report incorrectly attributed 8.75 ms to E.
Throughput in the uncapped run
0–5000 QPS
The common axis starts at zero. This load setting alone does not establish maximum sustainable throughput.
| Scenario | p99 @ 1,000 QPS (ms) | Uncapped run (QPS) |
|---|---|---|
| A: VPC CNI | 10.92 | 4103.9 |
| B: Cilium + kube-proxy | 9.87 | 4044.7 |
| C: Cilium, no kube-proxy | 8.91 | 4019.3 |
| D: Cilium ENI | 8.75 | 4026.4 |
| E: Cilium ENI, additional options | 9.89 | 4181.9 |
The 5,000-QPS target runs contain the following values. A run that misses the requested rate must not be described as successfully serving 5,000 QPS.
Table 5. Achieved QPS and p99 per scenario for the 5,000-QPS target runs
| Scenario | Achieved QPS | p99 (ms) |
|---|---|---|
| A | 4,071.1 | 440.45 |
| B | 4,012.0 | 21.60 |
| C | 3,986.5 | 358.38 |
| D | 3,992.6 | 23.01 |
| E | 4,053.2 | 24.44 |
For the 1,000-QPS target runs, the recorded A→E p99 difference is about 9.4%; A→D is about 19.9%. Replicates are needed before interpreting either as a significant improvement. The much larger p99 differences at higher load also need original response, error and CPU records.
Impact of Service Count Scaling on Performance (Scenario E)
The previous service-scaling charts have no per-run artifacts that can substantiate their values here. A few service-count observations do not prove constant latency or O(1) algorithmic complexity. A new experiment should control endpoint count, target Service position, connection creation rate and rule update rate as well as Service count.
kube-proxy (iptables) Service Scaling: 4 → 104 → 1,000
The counts 4, 104 and 1,000 identify the earlier proposed comparison points, not currently verified results. Rule traversal cost and measured HTTP latency are different quantities. In iptables mode, rules locate the destination Service and separate rules select an endpoint. It is inaccurate to assume that every SYN traverses half of all rules on average.
keepalive vs Connection:close Analysis
Connection reuse can reduce connection setup work. Conntrack tracks connection and NAT state; it does not cache packet contents. Separate new and established connections, TCP handshakes and application requests to identify the effects of kube-proxy and connection reuse.
DNS Resolution Performance and Resource Usage
The stored DNS p50/p99 values in milliseconds are A 2/4, B 2/4, C 2/2, D 2/4 and E 2/3. They come from getent and shell timing, so do not relabel them as CoreDNS processing latency. Lookup success, cache state and higher-resolution timing need verification. kubectl top output is not retained in the summaries; unsupported CPU/memory comparison values have been removed.
Impact by Tuning Point
E changes multiple options, so individual contributions cannot be calculated. To evaluate Bandwidth Manager, record Pod bandwidth annotations and effective configuration; evaluate BBR separately with TCP traffic. Assess conntrack map sizing with observed entries, pressure, drops and memory consumption.
Key Conclusion: Performance Difference vs Feature Difference
The available material establishes what five summaries contain and which differences need another measurement. UDP loss alone cannot rank the products overall, and similar TCP throughput cannot establish equivalence across workloads.
Compare policy capabilities and Service processing against official feature documentation. Measure throughput, latency and operating costs using configurations that meet the same requirements. Instead of assuming that eBPF is inherently faster, identify the packet-path work a feature changes and measure whether that change benefits the application.
Analysis and Recommendations
Key Findings
The clearest findings are incorrect metric labels, confusion between D and E, and mismatches between the intended configuration and the narrative. Repeatability and the causes of performance differences remain unverified.
Recommended Configuration by Workload
Table 6. What to compare for each required behavior
| Required behavior | What to compare |
|---|---|
| HTTP services | Errors and p99 at target load, connection reuse, server/client CPU |
| UDP streaming | Received throughput at acceptable loss, pacing and packet size |
| Many Services/endpoints | Rule update time, new connection rate, data-path mode |
| Agent/model services | Actual tool-call and streaming paths, policy enforcement, end-to-end response time |
| Detailed egress controls | Supported DNS/FQDN/L7 rules and their observability/operational costs |
These records do not establish universal migration thresholds such as 500 or 5,000 Services. Decide from operating requirements, required capabilities, support ownership and measured results.
Configuration Notes
eksctl Cluster Creation
The saved EKS 1.31 configuration is historical input. Select a supported EKS/Cilium combination for a new experiment. Define creation/deletion permissions, costs and cleanup for a dedicated environment rather than converting an existing production cluster into the test system.
Cilium Helm Chart Compatibility
Value names, types and defaults can change across chart releases. Check the selected version's documentation and retain rendered resources, effective values and Cilium status. A successful install command alone does not establish that ENI, host routing, BBR and XDP are all active.
XDP Acceleration Requirements
Native XDP support depends on the driver, kernel, MTU and device configuration. Blanket claims that ENA or virtualized environments cannot support it, or that CPU architecture alone determines support, are inaccurate. Cilium documents an AWS ENA XDP setup. That example does not prove a successful run on this experiment's m6i.xlarge and Cilium 1.16.5 configuration.
DSR (Direct Server Return) Compatibility
DSR lets a backend return traffic directly to the client. XDP accelerates selected ingress paths; DSR does not inherently require it. Subject to its prerequisites, Cilium XDP acceleration can apply to DSR, SNAT and hybrid modes. AWS deployments also need suitable source/destination checking, encapsulation and network handling of packet options.
Workload Deployment
Separate same-node and cross-node cases explicitly. Validate response content, errors and actual endpoints in addition to readiness. Observe CPU throttling and load-generator saturation so that they are not mistaken for network effects.
CNI Transition Pod Restarts
A CNI change affects Pod connectivity and is not an ordinary application restart. Kubernetes Deployment defaults are maxSurge: 25% and maxUnavailable: 25%, with different rounding rules. A rolling update does not always double Pod count. Account for small replica counts, spare capacity and terminating Pods when determining peak usage.
Deleting all Pods is not a safe general transition procedure. Verify recovery or recreation in the dedicated experiment cluster; handle service-environment migrations through a separately supported procedure and change plan.
AWS Authentication
Confirm the experiment account, role, region and cluster context first, and grant that role the required ENI permissions. Do not place long-lived keys in documentation or results. This report is not a complete authentication or CNI migration procedure.
Reference: VPC CNI vs Cilium Network Policy Comparison
AWS VPC CNI documentation describes Kubernetes NetworkPolicy with Pod/namespace selectors and CIDRs. Describing it as a policy that can only specify IP addresses is inaccurate. The FQDN example below uses a Cilium extension; this review has not established a VPC CNI FQDN feature, API, or supported release. Check official evidence for the APIs and versions being compared rather than claiming product exclusivity. Do not backdate current capabilities to the February 2026 experiment; record the supported versions and node types.
Key Differences
Kubernetes NetworkPolicy and Cilium extensions use different APIs and enforcement paths. Cilium HTTP L7 rules depend on proxy and TLS visibility; they do not automatically inspect paths inside arbitrary encrypted traffic. Hubble observations also depend on aggregation, filters, buffers and event loss, so avoid promising that every flow is always retained.
FQDN egress requires DNS lookup permission as well as domain rules. This illustrative Cilium policy permits app: api-client Pods in bench to query CoreDNS and reach api.example.com over TCP 443. Check the DNS Pod labels and resolver path in the target cluster. The example has not been executed in this review.
apiVersion: cilium.io/v2
kind: CiliumNetworkPolicy
metadata:
  name: api-client-egress
  namespace: bench
spec:
  endpointSelector:
    matchLabels:
      app: api-client
  egress:
    - toEndpoints:
        - matchLabels:
            k8s:io.kubernetes.pod.namespace: kube-system
            k8s:k8s-app: kube-dns
      toPorts:
        - ports:
            - port: "53"
              protocol: ANY
          rules:
            dns:
              - matchPattern: "*"
    - toFQDNs:
        - matchName: api.example.com
      toPorts:
        - ports:
            - port: "443"
              protocol: TCP
The DNS * does not permit TCP connections to every destination. Conversely, a broad egress pattern such as *.amazonaws.com does not restrict traffic to one AWS service. Specify the required service/region endpoints and ports, then test allowed and denied cases.
References
- Saved scripts and result summaries
- Amazon EC2 M6i specifications
- Cilium kube-proxy replacement, DSR and XDP
- Cilium Bandwidth Manager and BBR
- Cilium DNS and FQDN policies
- Amazon VPC CNI NetworkPolicy
- Kubernetes Deployment RollingUpdate
- iperf3 manual
These official references were reviewed on 2026-09-19. Historical run prerequisites still require the relevant release documentation and effective configuration.